
A Comfort property in Ohio | Partnered with Atica since February 2023
Hotel Revenue Management Results: +48% Revenue Growth in Under Three Years
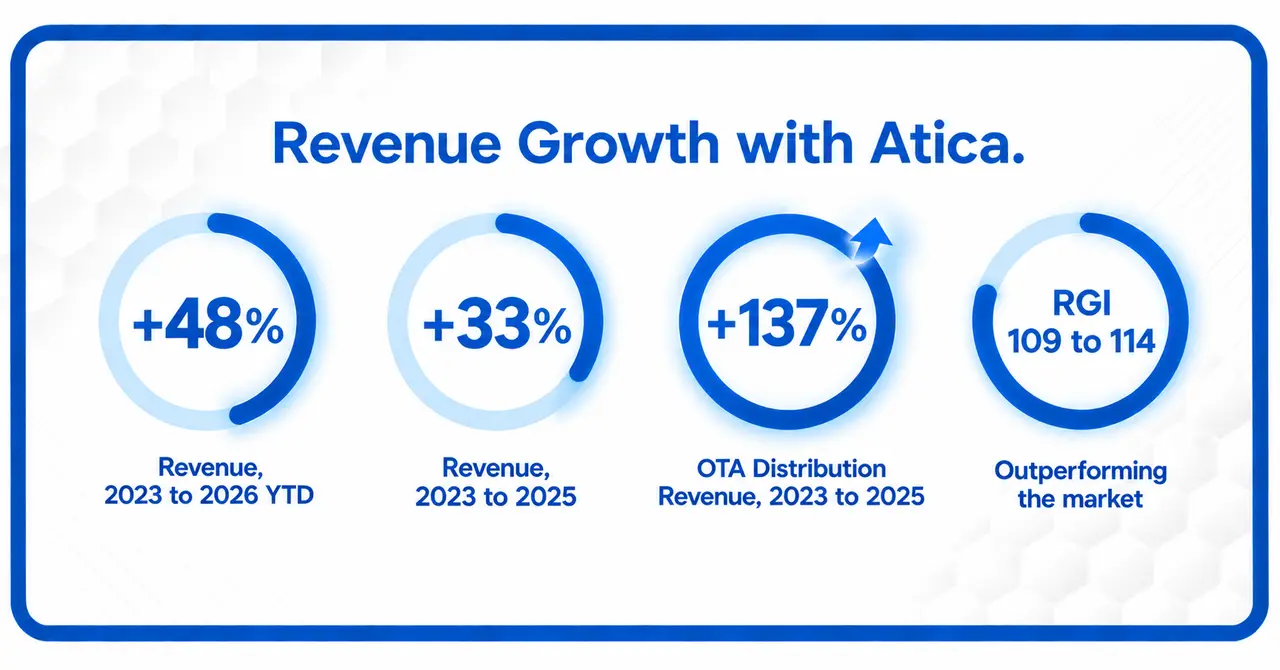
- +48% Revenue, 2023 to 2026 YTD
- +33% Revenue, 2023 to 2025
- +137% OTA distribution revenue, 2023 to 2025
- RGI 109 to 114: outperforming the market in every period
The Challenge: Growing a Renovated Hotel Against Stronger Brands
The property signed with Atica in February 2023 and spent almost the entire year under full renovation. At 85 rooms, it competes against stronger-branded hotels: Holiday Inn (IHG), Tru by Hilton, and upper-midscale Choice and Wyndham properties, averaging 90 rooms. The goal was to get it back on track quickly, then grow it ahead of the market.
The Result: Hotel Revenue Growth in Every Year Since the Renovation
- 2023 (renovation year): $1.6M revenue | Baseline | ADR $106
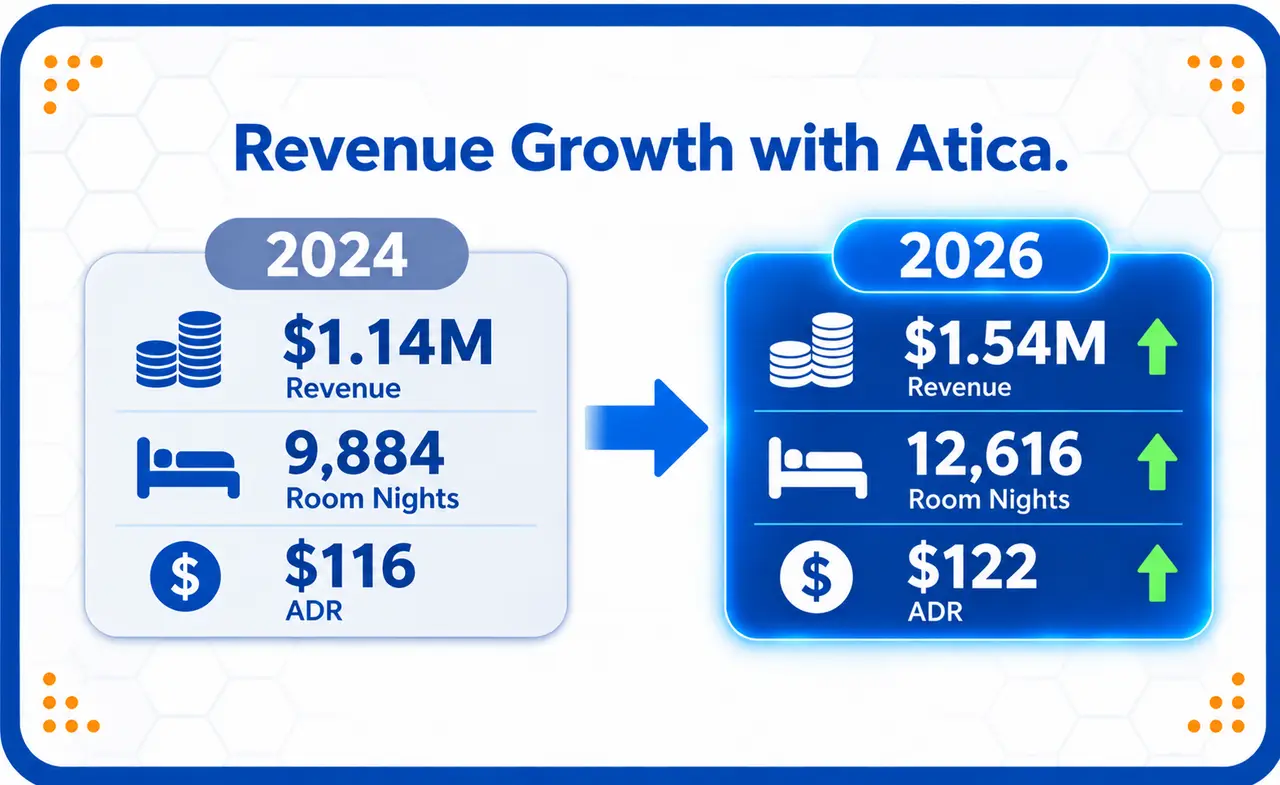
- 2024: $1.9M revenue | +20% | ADR $108
- 2025: $2.1M revenue | +11% | ADR $108
- 2026 YTD (Jan to Oct): $2.4M revenue | +11% vs. full-year 2025 | ADR $120
Property revenue reports, rounded; 2026 is January to October.
- +33% revenue in two full years, with room nights up 31%.
- 2026 has already passed all of 2025 with two months still to go.
- RevPAR rose from $52 to $69 (+33%) between 2023 and 2025, and averages $92 for January to October 2026.
- ADR is up 13% to $120, so growth is now driven by rate as well as volume.
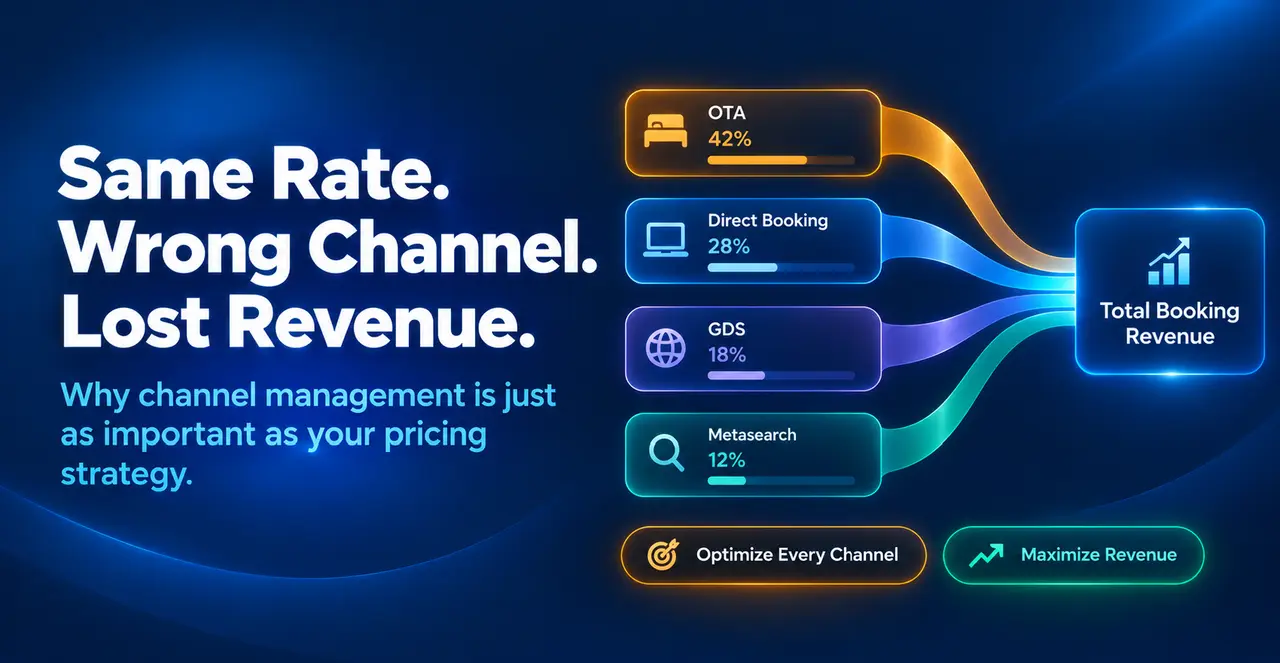
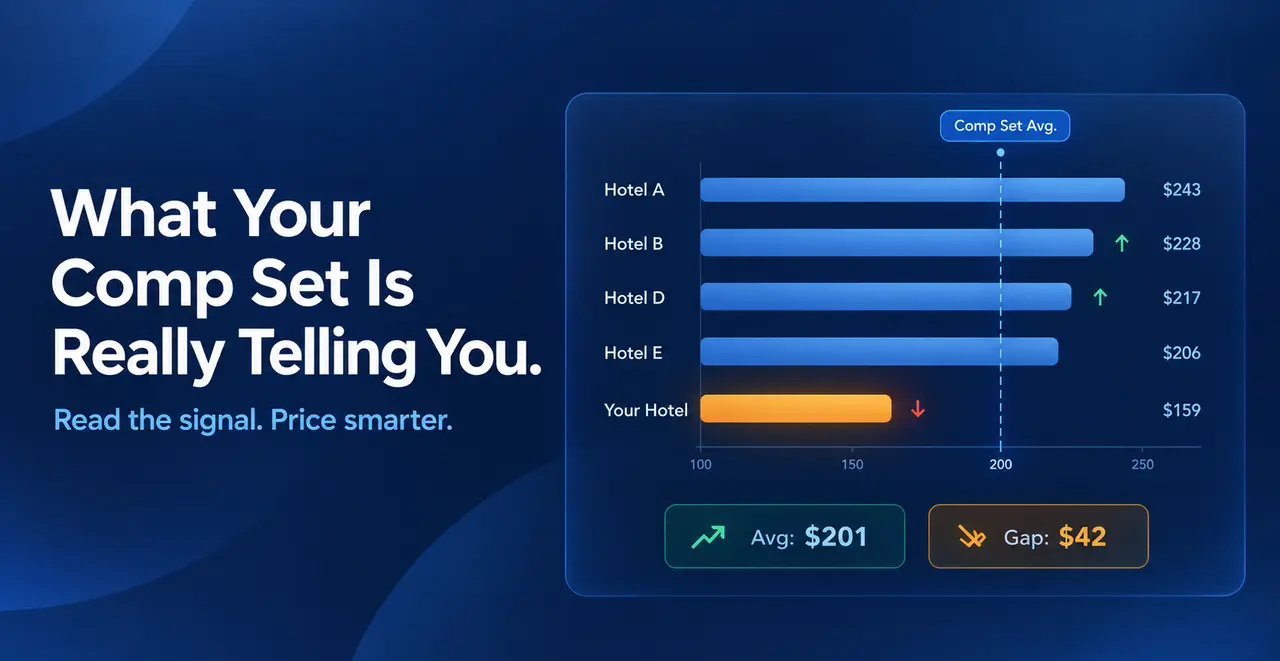
The engine behind every channel: pricing reviewed at least 3 times a day against comp-set rates and inventory, 365-day rate monitoring every month, and sharp focus on event and high-demand dates.
Hotel Revenue Growth by Segment
Property revenue reports by source bucket, rounded; full years 2023 to 2025.
Brand Direct is the largest base, while OTA and OTA distribution are the fastest-growing.
Brand Direct Revenue, up 20%
$560K to $670K (2023 to 2025) | ADR +18%, from $106 to $125 in 2026 YTD
- Property rename for SEO and keywords (mid-2023): brand revenue rose 70% in the 6 months after the rename, against the 6 months before.
- Funded advertising after the renovation: brought the property back on track and into search results quickly.
- Competitive discounting and promotions: promotion-driven revenue up 35%.
- Inventory optimization and room offset strategy: higher net revenue from the brand website.
OTA Revenue Optimization, up 71%
$270K to $460K (2023 to 2025) | 2026 YTD at $490K, already above all of 2025
- Booking.com: +154%, from $90K to $225K, with ADR reaching $140 in 2026.
- Agoda/Priceline: 10x growth, from $3K to $33K.
- Listing optimization: photo ordering, amenity listings and ratings management lifted organic visibility.
- Rate parity checked on every OTA portal to protect conversion and price integrity.
- Competitive promotions to win share against the comp set.
Property revenue reports by channel, rounded; 2026 is January to October.
OTA Distribution Revenue, up 137%
$70K to $160K (2023 to 2025) | 2026 YTD at $260K (+63% vs. full-year 2025) | ADR +20%, from $93 to $112
- Expedia distribution: from $4K to $94K in 2026 YTD.
- Packages: from $22K to $70K in 2026 YTD (3x).
- Behind it: daily inventory optimization and rate parity monitoring across every distribution partner.
Winning Against Bigger Brands (STR)
In a 7-hotel competitive set, the property beat its fair share of the market in every period and climbed the RevPAR ranking.
- Aug to Dec 2024: RevPAR rank 4 of 7 | RGI 114
- 2025: RevPAR rank 3 of 7 | RGI 109
- 2026 (Jan to Sep): RevPAR rank 3 of 7 | RGI 110
- Summer 2026: RevPAR rank 2 of 7 (avg.) | RGI 115
RGI above 100 means the hotel is earning more than its fair share of market revenue. STR-based monthly RevPAR from the property’s revenue report; 2025 and 2026 January to September.
The Atica Effect: Pricing, Distribution and Channel Management
From a renovation-year baseline, this 85-room Comfort property now outperforms higher-valued brands, with growth in every segment. The same approach (smart pricing, optimized distribution and disciplined channel management) can work for your property.